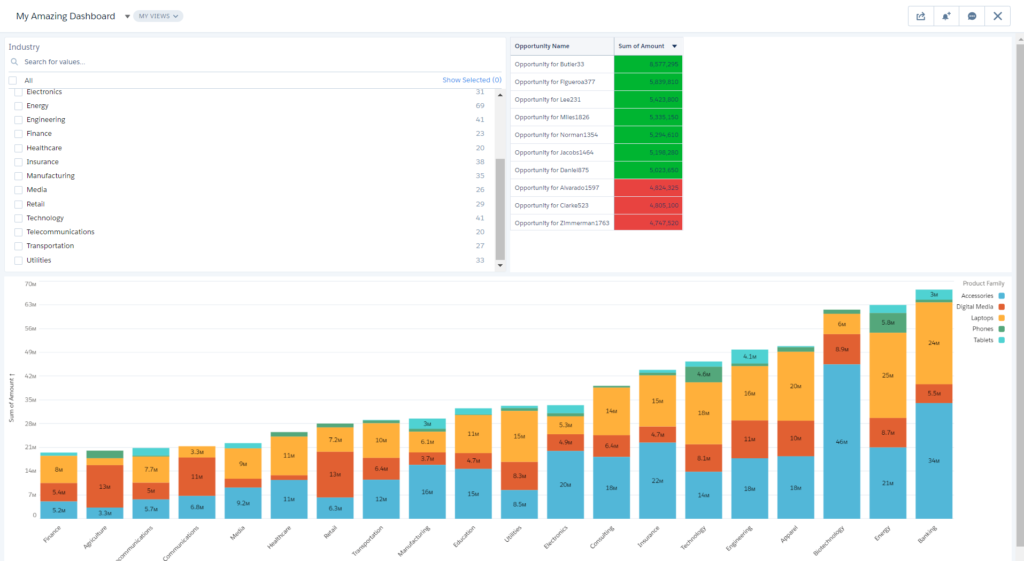
Starting Einstein Analytics..
November 24, 2019
I have been putting my foot on & off on this Piece (relied on Dashboards extensively). After viewing 2019 Dreamforce Product Keynotes, I got sold to join the party.
- As usual, the Trailhead is amazing – Must do Project, it takes <45 mins approximately.
- You can create a free analytics-enabled developer edition.Click Here.
- The starting point is Clicking on Dataset and Creating a Lens.
- Lens is something where you can group by data and also Charts.
- We need to “clip to designer” by opening lens and give it a name.
- We can then add this Query to Dashboard.
- Conversational Query : ” A conversational query starts with a word or two from you, and then Einstein Analytics provides suggestions that you can accept or edit. In this section, you see how quickly you can hold a conversation with your data, and then add the results to the dashboard. “
- I created my first conversational Query “top 10 opportunity name” suggested by einstein.
- Then i did Custom Formatting @ Column in Dashboard Editor.
- Then I created my own view by selecting few Industries
- Then I gave access to the app.
- This is crazy if used in right way. I could use the annotation feature to post chatter comments and start a conversation right there….
